
She was cleared to return to play. She felt ready. Her care team believed she was ready. And within weeks, she re-strained the same hamstring.
That’s the story of an athlete who came to us at Better with Physical Therapy — and it’s a story about the gap between how someone feels and what the data actually shows.
Cleared on a Feeling, Not on Data
Clearance decisions are often made the same way: the athlete says she feels good, the pain is gone, range of motion looks fine, and she’s given the green light. On the surface, that seems reasonable. But “feeling ready” and “being ready” are not the same thing — and the difference between them is exactly what data is built to catch.
When she came to us after that first, premature clearance, we ran an initial DynaMo assessment of hamstring strength. The result told a very different story than how she felt:
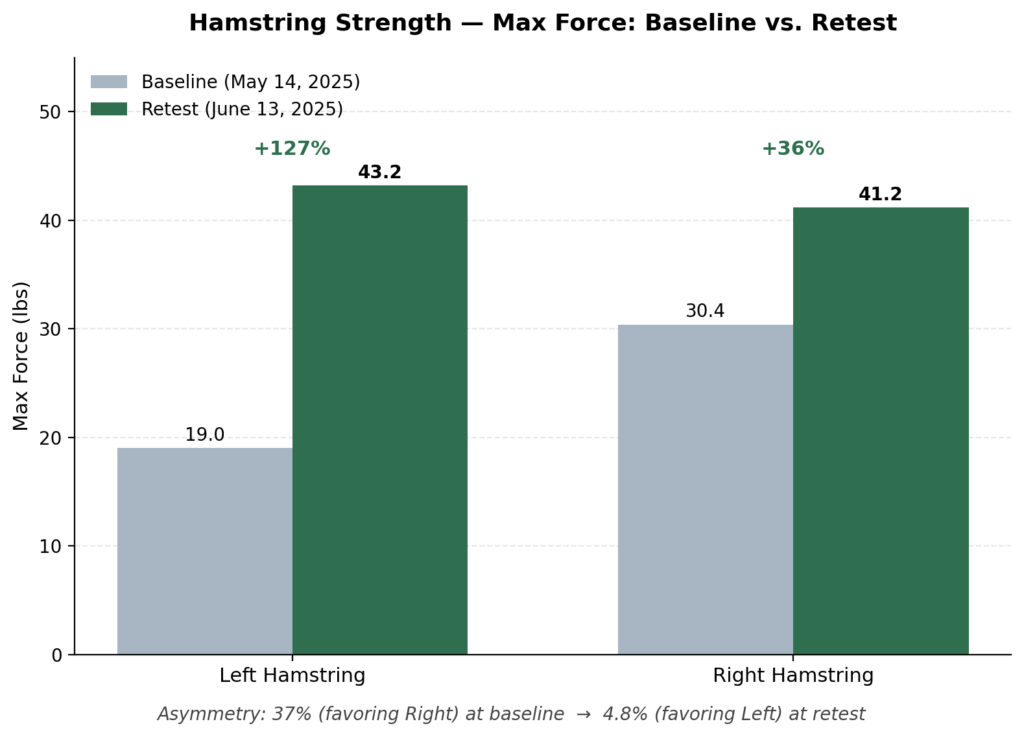
Her right leg was producing 37% more force than her left.
A 37% asymmetry doesn’t show up in a conversation. It doesn’t show up in a pain scale, a range-of-motion screen, or an athlete’s own sense of readiness. It shows up in a number — and it’s a number that was never captured the first time she was cleared. That gap is exactly why she got hurt again.
This is the core issue: a feeling can’t be measured against a threshold. Data can. “I feel ready” has no objective line to clear. “37% asymmetry” does — and it was well outside any safe range for return to play.
Why Specific Testing Enables Specific Intervention
Once the asymmetry was on the table, the plan stopped being generic. Instead of a standard strengthening protocol applied evenly to both legs, her program at Better with Physical Therapy was built around one specific target: closing the deficit on the left side before clearance was even considered again.
That’s the difference specific testing makes — it doesn’t just tell you that something is off, it tells you exactly what and exactly where, so the intervention can be built to match:
- A feeling gives you a vague plan. “She feels stable” leads to a generic return-to-play protocol with no real benchmark.
- A measurement gives you a targeted plan. A documented 37% left-side deficit leads to a program built specifically to load and strengthen that limb.
- A measurement gives you a finish line. The goal isn’t “get stronger” — it’s “close the asymmetry to a safe range before clearance.”
- A retest gives you proof, not a guess. On retest, her asymmetry dropped to 4.8% — objective confirmation that she was ready this time, not just a feeling that she was.
If clearance had been based on feeling again, there’s no reason to believe the outcome would be different — it wasn’t the first time, and that’s precisely what led to re-injury.
The Takeaway
“She feels ready” is an opinion. “37% asymmetry” is a fact. Only one of those should be allowed to clear an athlete for return to play.
Data-driven decisions follow a clear line: specific baseline → specific intervention → specific retest → confident decision — with an objective number at every step, not a sense of how things seem. Skip the data, and you’re left clearing athletes on impression alone, which is exactly what happened the first time around.
The next time “she feels ready” is on the table, ask instead: what does the data say? That question is the difference between a clearance that holds and one that doesn’t.
-Will Hylton, PT, DPT, OCS, CSCS,
Clinical Director at Better With Physical Therapy
(973) 791-8337 | 306 Main St Ste 12, Madison, NJ 07940